

There are 6,767 businesses in Cleveland County with no employees and 2,028 with at least one. That is 76.9% of every business here running on one person and no payroll. Of the employers that remain, half have fewer than five people. The local business almost everybody writes advice for is the exception.
These are administrative counts from the US Census Bureau, not survey estimates, so there is no margin of error to argue about. The problem is what gets built on top of them: almost every tool, price and process aimed at small business assumes a company with staff.
- 76.9% have no employees. 6,767 sole proprietors, 2,028 employers, 3.3 to 1.
- Half the employers are under five people. 1,047 of 2,028.
- The average no-payroll firm books about $37,400 a year. An average, not a typical one.
- Employer growth stalled two years ago. Up 10% over five years, 1.9% below the 2023 peak.
How many businesses here actually have staff?
About one in four, on the 2023 counts that are the most recent the Census publishes at county level. It records 2,028 employer establishments in this county and 6,767 nonemployer firms, which works out at 3.3 sole proprietors for every business with a payroll.
A nonemployer firm is a tax filing with no employees. The one-person garage, the stylist renting a booth, the guy with a truck and a licence, the bookkeeper working from a spare room. Between them they make up the majority of businesses operating around here, by a wide margin.
This is also why an employer-only source misleads. Payroll counts from the Bureau of Labor Statistics are quarterly, accurate and quick to publish, and they describe about a quarter of the businesses in this county. Any figure drawn from them and then described as "businesses in Cleveland County" is off by roughly a factor of four before the conversation even starts.
| employer establishments | 2,028 |
|---|---|
| nonemployer firms | 6,767 |
| nonemployer share of all businesses (%) | 76.9 |
| sole proprietors per employer | 3.3 |
| total nonemployer revenue ($M) | 253.3 |
| mean revenue per nonemployer firm ($) | 37,426 |
Cite as. US Census Bureau County Business Patterns and Nonemployer Statistics, 2023. Retrieved from studioobrien.com/blog/most-local-businesses-have-no-employees#ds-county-nonemployer-economy.
What does a business with no employees earn?
About 37,426 dollars a year on average. Those 6,767 firms reported 253.3 million dollars of revenue between them in 2023.
The word average has to travel with that figure, because the 2023 distribution behind it is heavily skewed and the Census publishes no county median. A handful of larger sole proprietorships pull the mean up, so the typical firm takes in less than $37,400, probably by a good margin. It also includes part-time and side income, so this is not 6,767 full-time livelihoods.
The scale is the useful part. A business at that revenue level is choosing between doing nothing and spending a sum it can feel, and no agency shortlist comes into it. Anyone selling into this market has to price against that, which is why we scope from what a site has to earn back rather than from a package tier.
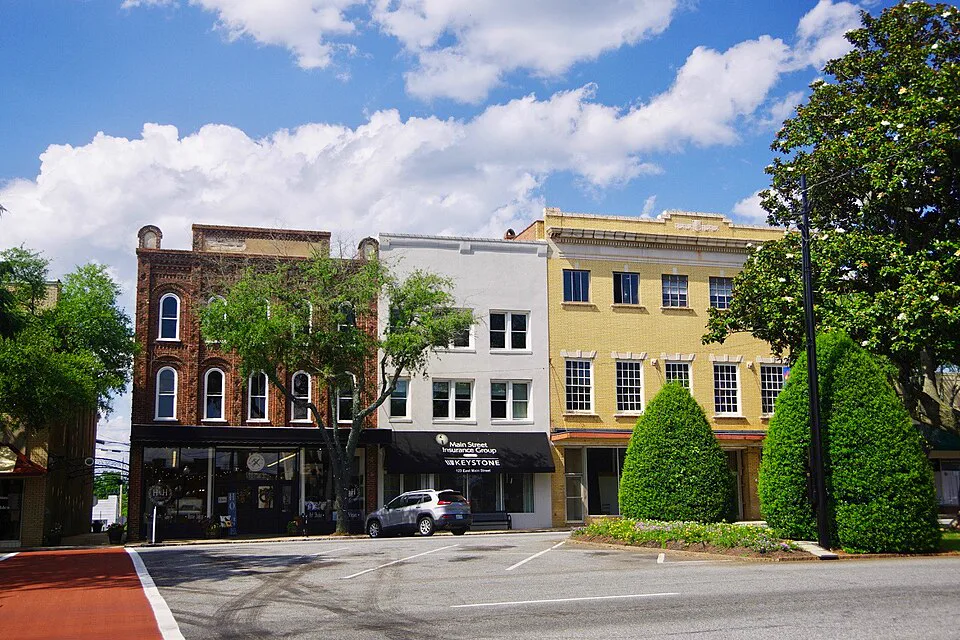
How small is a small employer here?
Smaller than the phrase tends to suggest. Of the 2,028 employer establishments counted in 2023, 1,047 have fewer than five people. That is 51.6%. Fewer than ten covers 72.3% and fewer than twenty covers 85.3%.
At the other end, 2.4% of establishments employ 100 or more people, and the county publishes no size class at 1,000 or above at all.
Set beside the nonemployer count, roughly nine businesses in ten across Cleveland County are either one person or a shop with fewer than five. Whoever answers the phone is usually also the person doing the work, which decides turnaround times, who actually reads a proposal, and when it is reasonable to expect a reply.
| employer establishments | 2,028 |
|---|---|
| establishments with fewer than 5 employees | 1,047 |
| share with fewer than 5 employees (%) | 51.6 |
| share with fewer than 10 (%) | 72.3 |
| share with fewer than 20 (%) | 85.3 |
| share with 100 or more (%) | 2.4 |
| establishments not allocated to a size class | 2 |
Cite as. US Census Bureau County Business Patterns, 2023. Retrieved from studioobrien.com/blog/most-local-businesses-have-no-employees#ds-county-employer-size.
Is the employer economy growing?
It grew for two years and then stopped. Across 20 quarters from 2021 Q1-2025 Q4, employer establishments went from 2,123 to 2,336, a gain of 10%. The peak was 2,381 in 2023 Q4.
So the latest quarter sits 1.9% under the high water mark set two years earlier. Restaurants followed the same line, up 8.8% across the series and off their own peak.
One caution carries real weight here. Part of every fourth-quarter to first-quarter step in this series is annual reclassification rather than businesses closing, and this data cannot separate the two. The drop shows up at 2024 Q1 and 2025 Q1 but not at 2022 Q1 or 2023 Q1, which means it is neither purely an artefact nor purely closures. Treat the level as solid and the quarter to quarter steps as noisy.
| quarters in the series | 20 |
|---|---|
| period covered | 2021 Q1-2025 Q4 |
| employer establishments at the start | 2,123 |
| employer establishments in the latest quarter | 2,336 |
| change across the series (%) | 10 |
| peak quarter establishment count | 2,381 |
| latest vs peak (%) | -1.9 |
| restaurant establishments, change across the series (%) | 8.8 |
Cite as. BLS Quarterly Census of Employment and Wages, 2021 to 2025. Retrieved from studioobrien.com/blog/most-local-businesses-have-no-employees#ds-county-employer-trend.
Why does this change who you build for?
Because a flat market with no staff in it rewards being findable rather than being patient. If the count of businesses is not growing, the work available comes from a neighbour rather than from expansion, and the businesses competing for it are one person deep.
Three practical consequences, in the order they usually bite.
- Nobody has an internal person. There is no marketing coordinator to hand a login to. Anything that needs weekly attention will not get it, so the build has to work unattended.
- Price against a real number. Against average nonemployer revenue, a four figure quote is a visible share of the year. It has to be defended in payback, not in features.
- Speed of reply is a competitive edge. When 85% of employers are under twenty people, the business that answers the same day wins work on that alone.
It also reframes what our own local search scan found. When we ran 72 local searches across twelve towns, we surfaced 239 businesses and roughly half had no website listed. Set against these Census counts, that scan saw about a third of the establishments and sole proprietors in the trades it searched. The businesses it missed are, by definition, the ones ranking worst, and those skew hardest toward the one-person end of this distribution.
What can this data not tell you?
The limits matter as much as the counts, and they are short enough to read.
- The Census vintage is 2023, the newest published for both series. Federal establishment data carries a structural two year lag.
- An establishment is a location, not a company. A firm with two sites counts twice.
- County Business Patterns counts establishments and Nonemployer Statistics counts firms. Adding them gives a usable denominator, not a single consistent unit.
- Average nonemployer revenue is a ratio of two published totals. It is not a typical firm and there is no county median to check it against.
- Size classes do not sum exactly to the published total, because cells that would identify a single business are suppressed. Two establishments sit in that gap.
- The payroll trend counts employers only, and part of each first-quarter step is reclassification rather than closure.
When does this get updated?
Census establishment data lands roughly once a year with a two year lag, and the payroll series updates quarterly. We re-pull both on a fixed schedule and publish the change, including the quarters that do not flatter the argument above.
Studio O'Brien is in Shelby and builds for exactly the businesses these counts describe, which is the reason we bother measuring them rather than quoting a national average at people. If you want the numbers for your own trade code instead of the county total, ask and we will pull them.
Common questions
How many businesses in Cleveland County have no employees?
6,767, against 2,028 employer establishments, from Census Nonemployer Statistics and County Business Patterns for 2023. That is 76.9% of all businesses in the county, or about 3.3 sole proprietors per employer.
Is 37,400 dollars what a one-person business here typically earns?
No. It is the average across all 6,767 nonemployer firms, and the distribution is heavily right-skewed, so the typical firm earns less. The Census publishes no county median for this series, which is why the word average has to travel with the figure.
Does this include businesses that are somebody's side income?
Yes. A nonemployer firm is a tax filing with no payroll, which covers part-time and supplementary income as well as full-time self-employment. So this is not a count of 6,767 full-time livelihoods.
Where do these numbers come from?
US Census Bureau County Business Patterns and Nonemployer Statistics, 2023 vintage, and the Bureau of Labor Statistics Quarterly Census of Employment and Wages for the payroll trend. We pull them directly from the public APIs and recompute every figure here from the saved raw response each time the article is rebuilt.
Sources: 1. US Census Bureau, County Business Patterns, 2023. 2. US Census Bureau, Nonemployer Statistics, 2023. 3. US Bureau of Labor Statistics, Quarterly Census of Employment and Wages, 2021 Q1 to 2025 Q4. Local search figures are our own measurement across Cleveland County, collected 2026-07-27.